
Hi Archinect!
From the OpenVis Conf website:
Marian Dörk is a research professor for information visualization at the Potsdam University of Applied Sciences. Motivated by the design opportunities and research challenges arising from growing information spaces, Marian is particularly interested in the potential of visual interfaces to support exploratory information practices.
About Marian's talk, again from the OpenVis Conf website:
Visualization promises to enable data analysis at a high-level. Typically relying on aggregation, machine learning, and statistics, the resulting representations offer abstract shapes that take the place of rich resources and relationships. While overviews are consensually considered to be useful, they also tend to distance us from the data they promise to help us understand.
In this talk, Marian will make the case against the primacy of overviews and advocate for a navigational approach to visualizing text corpora and faceted collections. He will cover practical aspects of creating visualizations for navigation as well as conceptual aspects about representation. Marian will synthesize the experiences from several design studies that involved close collaborations with book editors, a corpus linguist, other researchers as well as observations from week to year-long deployments.

Normally, Marian says, we take a bird's eye view of phenomena when visualizing data, this "objective" view isn't always the most informative. But what about partial, situated perspectives? (See the video at the bottom of this post.) What about the perspective of the flâneur? The flâneur is a curious explorer, open to roaming in an open way; the flâneur is also a critical spectator, who may take the time to see what others don't; and the flâneur is a creative mind.

In terms of data visualization, we can think about information flâneurs not just as people who lack a properly technical approach, but as people who are curious, critical, and creative.

How do people relate to information spaces? Explorability matters, and has to do with orientation (how a flâneur walks through a city--by knowing that I can find my way back home, I am freer to roam), continuity (can display states relate one to the next, so that the visual experiences is not disconnected), and serendipity (encountering data that we haven't thought of before, but that ends up inspiring us, so we can move laterally).
Pivot Paths was a project that Marian did at Microsoft Research, relating to the idea of strolling. In this view, which shows publications by one of Marian's colleagues, the green text shows the title of publications, the red words at the bottom are topic keywords, and the blue names at the top are co-authors, so that you can track collaborators.
You can then click on each paper, and see on the left and right, papers that this one cites and papers that in turn are cited by it. This is a web-based tool that is mostly text and that has very little graphic content.
You can also compare two authors; here, like a Venn Diagram, we can see in the center any papers these two authors have written together, and on each side, the papers that these authors have written independently than the other. The words at the bottom and top then re-sort to give us a world-cloud sense of how these two people's interests and collaborators compare.
 This interface was used within Microsoft Research; people liked the movement, though people were surprised not to see familiar capabilities to zoom in, for example on a single paper. Another drawback is that not all papers are given presence in the interface, (I think this is because of limited space, and because they wanted to focus on the most interesting connections.)
Here's an early prototype for another project, which executes a text analysis (tag cloud) that is interactive, so that you can see the words that are associated with a given word (in this case, "little.") The sentences in which the relevant word is used are also shown.
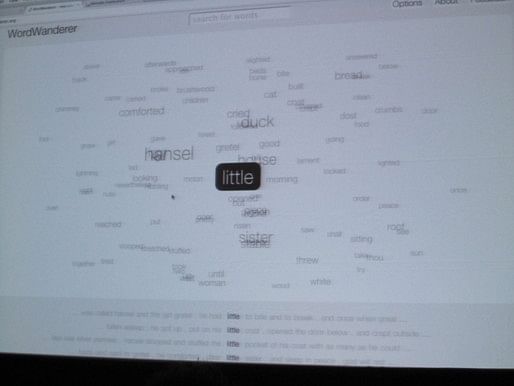
This tool has been released for several months, and the feedback given on the site was largely from language teachers, who used to the tool in order to understand how words tends to be used.
The last project Marian is presenting is called "nomadic exploration," and they've used it to visualize a book project called Beautiful Trouble, which has its own networked structure in how it uses tags. You can search by text that you enter, which will highlight the phrases/topics that are most related, and you can then click on each of those to continue exploring the text. You can also filter by legend. Working closely with the authors of the book, they felt that this was a kind of "living table of contents."
In sum, Marian argues that we don't always need to start a visualization with an overview, but rather, we can start somewhere and invite people to explore, by using data points as anchors for navigation. The data changes can be animated, to help people understand their navigation as continuous; and the interface can invite roaming and serendipity.
Thanks for reading!
Lian


This blog was most active from 2009-2013. Writing about my experiences and life at Harvard GSD started out as a way for me to process my experiences as an M.Arch.I student, and evolved into a record of the intellectual and cultural life of the Cambridge architecture (and to a lesser extent, design/technology) community, through live-blogs. These days, I work as a data storyteller (and blogger at Littldata.com) in San Francisco, and still post here once in a while.


2 Comments
maybe I am missing something something but what is context for video? dig the music...
Hm, the video does seem a bit out of context! I think this was part of Marian's conversation about flâneurs...he showed this clip during his talk and it made sense at the time...
Block this user
Are you sure you want to block this user and hide all related comments throughout the site?
Archinect
This is your first comment on Archinect. Your comment will be visible once approved.